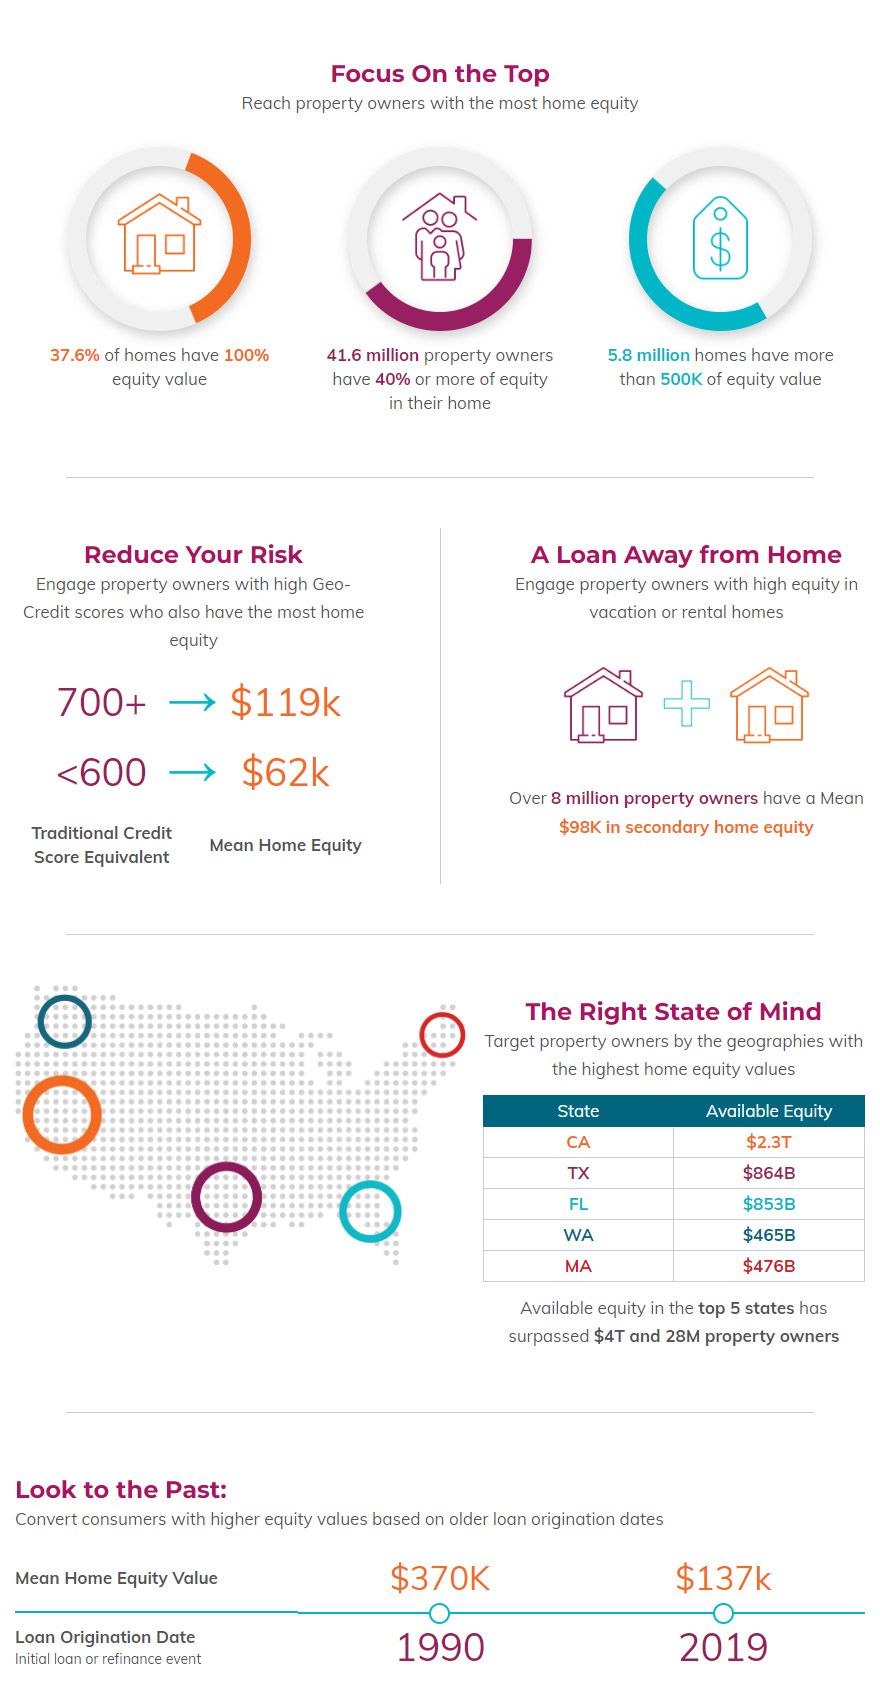
Infutor Home Equity Value – Your Key to Reaching the Best Prospective Borrowers with the Right Message
The game has changed for lenders in 2020
Low interest rates and high unemployment has caused a huge spike in homeowners looking for equity lines of credit or a cash-out refinance. In late May, refinance activity was up 176% (including cash-out refinances) from the same week a year ago. The high number of applicants has created a bottleneck for lenders.
So, how can you…
- find the best-qualified prospects
- make every marketing dollar count
in an evolving landscape with unprecedented demand?


 Your Privacy Choices for Platform Services | Data Services